Xu Shuang
Ankerui Electric Co., Ltd. Â Â Â Jiading 201801
1 Overview
In recent years, China’s medical industry has developed rapidly. A large number of high-tech medical equipment have been introduced. Medical treatment has grown to large-scale and group-based. The level of medical technology can be comparable to that of developed countries such as Europe and the United States, accompanied by energy consumption. As it goes straight up, the energy consumed includes electricity, oil, gas, water, etc., and the energy consumption is large. The hospital belongs to a public building. Therefore, for the energy management system of the hospital industry, we hope to achieve the goal of achieving a reduction in energy consumption while increasing energy use while ensuring a certain degree of safety, comfort, and convenience. quality. In the process of improving quality, energy consumption is also saved to a certain extent, energy use efficiency is improved, and both energy and quantity are improved in the process of energy consumption. Â
2 medical building energy consumption characteristics
Compared with public buildings such as office buildings, shopping malls and hotels, the energy consumption index of hospitals is relatively high. First, there are many types of energy-using equipment, covering hospital buildings, office buildings, medical equipment, office equipment, and transportation vehicles; secondly, it has characteristics of multiple units, wide classification, different features, and complex levels; and thirdly, hospital consumption. Can involve water, electricity, heat, gas, natural gas, fuel and other resources. In particular, the electricity load is large, which accounts for about 80% of the total energy consumption , and the fluctuation of the electricity load also varies greatly. Due to factors such as seasonal alternations, climate changes, day-and-night circulation, and changes in people flow , the overall energy consumption is not constant. The characteristics, from the perspective of energy conservation, energy-saving space is also huge.
Therefore, in this case, to implement meticulous management, it is necessary to fully understand the energy consumption of various parts of the hospital, to grasp the distribution rules of various types of energy in time and space, and to use a certain auxiliary analysis tools to the energy consumption of the hospital. Quantify the indicators. Therefore, it is imperative to carry out sub-item measurement of energy consumption in hospitals and monitor energy consumption, which is the basis of all energy conservation management work.
3 Feasibility Analysis of Energy Management System for Medical Buildings
    With the implementation of the GB 50189-2005 Energy Efficiency Design Standard for Public Buildings , the energy management system has been successfully applied in large-scale public buildings around the world , and has brought about good economic and social benefits. The medical and health building energy management system is a large-scale integrated automation system. It adopts a common software platform, a consistent hardware architecture, a unified human-machine interface, and establishes a highly shared information platform through the integration and interconnection of related systems. , To achieve information sharing and resource sharing among various departments within the building, thereby improving the efficiency of day-to-day hospital management and scheduling and the overall service level of the department's operations.
In addition, the data information is uploaded to the integrated monitoring system through the intelligent communication manager. Using this method not only can ensure that the collected equipment energy data can be sent to the monitoring system in time, but also has high reliability, simple system configuration, economy, and easy centralized management. On this basis, using advanced and reliable energy management software and hardware, a complete and advanced level of medical and health building energy management system can be established .
4 Application of Energy Consumption Management Analysis System in New Construction Project of Shanghai Huashan Hospital Ward
4.1 Project Overview
Shanghai Huashan Hospital Ward Building is a medical building with a floor area of ​​approximately 20,000 square meters . According to the requirements of distribution system management and energy consumption monitoring, it is necessary to conduct power monitoring on the high-voltage incoming line, low-voltage outgoing line, and distribution boxes in each floor in the building to realize on-line monitoring of electricity consumption and water consumption in the ward building. It is convenient to manage the energy consumption of this building group to ensure the safety and efficiency of electricity use.
Acrel-5000 building energy consumption analysis management system energy consumption data collection methods include manual collection methods and automatic collection methods. The data collected through manual collection includes the basic data collection indexes of the building and other energy consumption data that cannot be collected through automatic methods, such as the consumption of coal, liquefied petroleum, artificial gas and other energy consumption. The data collected through automatic collection includes building sub-item energy consumption data and classification energy consumption data. It is collected by the automatic metering device in real time and transmitted to the data center in real time through automatic transmission.
4.2 Network Structure
This system is mainly composed of three parts: data acquisition layer, data transmission network, and energy efficiency management system software.
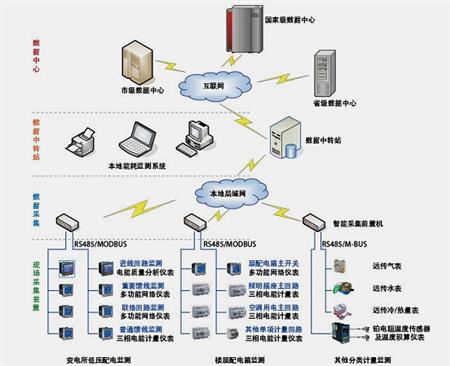
1, the data acquisition layer
Through the intelligent power meter with digital interface installed in the energy monitoring instrument box (cabinet), real-time monitoring of the load power consumption is implemented. Monitoring data includes: electrical parameters such as voltage, current, active power, reactive power, power factor, active and reactive power, harmonics, environment and switch status, and event records. The monitoring objects include the low-voltage feeder circuit on the power demand side, the main energy-consuming electromechanical equipment, and other energy-consuming facilities in the hospital. At the same time, data collection can be achieved through on-site smart metering devices such as electronic flow meters and electronic heat meters for water consumption, gas consumption, and heat. According to the site conditions and the requirements of the system application, the collected data can also be taken from the user's data interface of other intelligent systems. Â
2, data transmission network
Through the energy consumption intelligent data gateway installed in the energy consumption monitoring instrument box (cabinet), data of the energy consumption meter is collected in real time, and transmitted to the energy consumption monitoring center through the TCP/IP network. No need for long-distance wiring, construction is simple and reliable. The intelligent data gateway provides a variety of access methods and supports various methods including RS-485/RS-232 bus, optical fiber, industrial Ethernet, 433M wireless, and GSM/GPRS/CDMA network transmission.
3, electricity and energy efficiency management system software
Complete data collection, verification, analysis, processing, output, system maintenance, authorized use permission level control, etc.; and can transmit important data, alarm information, fault information, etc. that are run in the field to enterprise decision-makers.
4.3 Device Parameter List
name
Model, specification
unit
Quantity
Note
Field device layer
Electricity meters, etc.
 
only
407
 
Station control management
Workstation host
RPC-610 Core2 2.8G/2G/500G + Keyboard
station
1
North China Industrial Control
monitor
19W "LCD Monitor
station
1
AOC
UPS power supply
MT1000
station
1
SANTAK
printer
A4 format
station
1
 
Console
Steel wood structure with a chair
set
1
Shanghai Xiangming
Energy Analysis Software
System Configuration Software Acrel-5000
set
1
Ankerui
Energy Analysis Software
Data Storage Software Acrel-dbSQL
set
1
Ankerui
Energy Analysis Software
Energy Management Software Acrel-EnerSys
set
1
Ankerui
Energy Analysis Software
Device Driver Software Acrel-Driver
set
1
Ankerui
Energy Analysis Software
Report Analysis Software
set
1
Ankerui
Energy Analysis Software
Environmental monitoring software
set
1
Ankerui
Network communication layer
Industrial network switch
D-LINK 8 port
station
1
D-LINK
Industrial Serial Server
NPORT5630-16 RS485 interface × 16
set
2
MOXA
4.4 System Design Parameters
Telemetry accuracy rate:
≥99.9%
Analog measurement error:
<0.5%
Telemetry update period:
15min (minimum resolution 1min adjustable)
Call screen response time:
<2S
Accident push screen time:
<2S
Network rate:
10M/100M
Working environment temperature range:
-20 °C ~+55 °C
Relative temperature:
≤95% (25 °C )
Historical curve daily, monthly report storage time
≥1 year
System service life:
≥5 years
MTBF: MTBF:
≥30000 hours
4.5 System Functions
4.5.1 System energy consumption monitoring consists of energy monitoring platforms, switches, multi-function electricity meters, communication converters, remote water meters and other equipment . The key functions of this system are water and electricity consumption.
4.5.2 Support for the collection and management of energy data such as electricity and water under a unified network architecture. Energy consumption data collection does not need to be integrated in multiple different systems. The energy monitoring and management system contains a wealth of functions and can be applied to buildings or buildings. The various types of energy ( electricity, water ) are separately counted and managed in a unified manner, and energy consumption data is automatically collected, analyzed, excavated, and continuously optimized .
4.5.3 System Acquire the parameters sent from the intelligent measurement and control unit device, including the real-time energy value and various alarm information of each power circuit , the water consumption of each water meter, etc. , and real-time display the various parameters collected .
4.5.4 Timely , daily, monthly, and annual energy consumption report by each energy management group to help users master their own energy consumption and identify abnormal energy consumption .
4.5.5 System Support Remote browsing based on Internet , different energy management departments can check the consumption of required energy at different locations at the same time.
4.6 System Functions and Software Interface
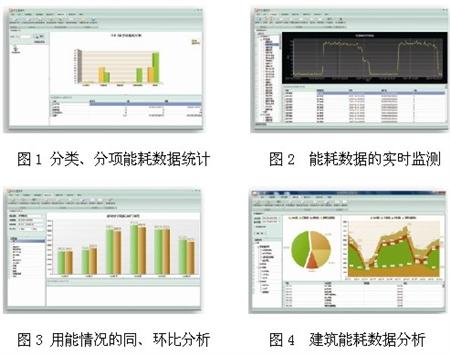
4.6.1 Statistics of Classification and Item Energy Consumption
The system has the storage function of historical data, alarm information, etc. The storage history data is saved for more than three years. The system also has the function of sending classified and itemized energy consumption data to higher-level data centers according to the requirements of "energy data that needs to be sent to the upper-level data center." The interface is shown in Figure 1.
4.6.2 Real-time monitoring of energy consumption data
The system has a good openness, can expand the function of the user's requirements, and customize the personalized report and analysis template for the user based on the basic analysis function; the system has an alarm management function, responsible for the transmission of alarms and events, alarm confirmation and alarm recording Function to inform the user or for user inquiries; the system has rights management, system log and system parameter settings and other functions. The interface is shown in Figure 2.
4.6.3 Analysis of the same-side and ring-wise ratio of energy use
Monthly, year-on-year or quarter-by-month analysis of energy consumption (standard coal or kilowatt-hours) and energy consumption per unit area (standard coal or kilowatt-hours) for each category, sub-item, etc. It can preset, display, query and print the statistical report of energy consumption of common buildings. The interface is shown in Figure 3.
4.6.4 Analysis of Building Energy Consumption Data
After collecting and summarizing classification and itemized energy consumption data, the system can generate various data charts, pie charts, and bar charts, and reflect and compare the values, trends, and distributions of collected data and statistical data in real time. The system can be summarized daily, month by month, year by year based on total energy consumption and energy consumption per unit area, and displayed, searched, and printed in various forms such as coordinate curves. The interface is shown in Figure 4.
4.6.5 Remote Network Access Function
After the system is published on the Web, remote network access is available. Based on the .Net platform, it is developed using ASP.Net and JQuery technology and can be accessed through the Internet. It has cross-platform features and users can access it through various mobile terminals (notebooks, tablet computers, mobile phones, etc.). The interface is shown in Figure 5.
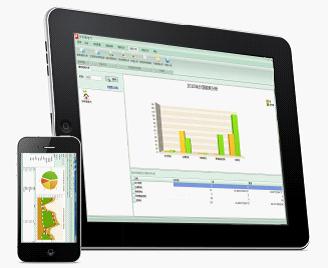
Figure 5 Cross-platform cross-network data access
4.7 Conclusion
Shanghai Huashan Hospital adopted Acrel-5000 energy management technology to establish a comprehensive monitoring and management of the entire hospital facility energy system. Real-time energy consumption of energy systems was achieved by collecting and monitoring energy consumption and energy efficiency data of the load energy consumption equipment. Effective monitoring and management provides effective tools and energy cost management tools for the operation and management of users' energy management systems, and provides analysis tools for further energy efficiency measures. The expected results have already begun to appear: Â
Acrel-5000 Energy Management System not only reduces the management intensity of large-scale and large-scale facility energy consumption, but also provides various classified reports, energy consumption curves and trend analysis, and improves operations by uploading full-time regional classification data. The efficiency of management. Â
Acrel-5000 automatically generates detailed breakdown data for various types of loads such as lighting, air conditioning and ventilation, providing a powerful cost management and control tool for management. Â
Through practice, it is proved that the application of Acrel-5000 energy management system in the medical and health industry brings very intuitive energy-saving economic effects, as well as good social and environmental benefits, not only for the medical and health industry, but also for other large-scale public buildings, comprehensive Building groups, industrial enterprises, infrastructure, large-scale parks, etc. have a good reference.
About the Author:
Zhu Xiaofang, female, undergraduate, Ankerui Electric Co., Ltd., the main research direction for the smart grid power distribution, Email: XXXXXXXXXXXXXX Mobile: XXXXXXXXXXXXX QQ: XXXXXXXXXXX
ã€references】
[1] Long Weiding. Building energy efficiency and building energy efficiency management. Beijing: China Building Industry Press, 2005
[2] Shanghai Ankerui Electric Co., Ltd. Product Manual. 2013.01.
"Atlas of Design and Application of Building Energy Consumption Monitoring and Management System" (atlas number: ACR12CDX301) edited by Ankerui Electric Co., Ltd. and Shandong Construction Electrical Technology Information Network, this atlas combined with Acrel-5000 energy consumption The monitoring system complies with the electrical design specifications and meets the requirements for the construction of energy-saving supervision systems for office buildings and public buildings of state agencies, to achieve the scientific and data-based management of green building energy use, and to achieve the goal of saving energy and reducing consumption of green buildings. The Atlas is applicable to the system design, construction, operation and maintenance of energy monitoring and management of office buildings and public buildings of newly-built or rebuilt national offices. If you need atlas, please provide your organization's name, department, address, zip code, contact person, contact telephone number, email address, fax 021-69155331, mail or QQ to Ankeru Xu cream engineer, Ankerui Electric will give you a free gift. .
1.Competitive price with high quality
2.Excellent friction performance
3.Non-asbestos,asbestos and other materials are available
1.The mould Brake Lining Roll is of high flexibility, toughness, shock resistance, wearability, fitness, sharp seneitivesness.
2.It is for Motocycle Parts
3.High quality Brake Lining to guarantee safety and reliability.
Such as Semi-Metal Brake Lining.
4.We can produce this item according to customers' requirements.
5.Packing: Woven ploy-bag
1)We can supply most kinds of brake linings for Japanese, European, Korean and American brand cars and trucks with OEM services available .The mould can be designed and developed as per clients' specifications, drawings or samples
2)These products sell well in more than 20 countries and regions including the North America,Southeast Asia, Europe, the Meddile East,America and Japan
3)We assure that all the parts meet the strictly original equipment standards


Motorcycle Brake Lining,CG125 Brake Lining for Brake Shoe,OEM CD70 Motorcycle Brake Lining,Semi-Metal Brake Lining
GREEN POWER INDUSTRY CO., LTD. , http://www.carparts-supplier.com